Married Americans Keep Voting Red
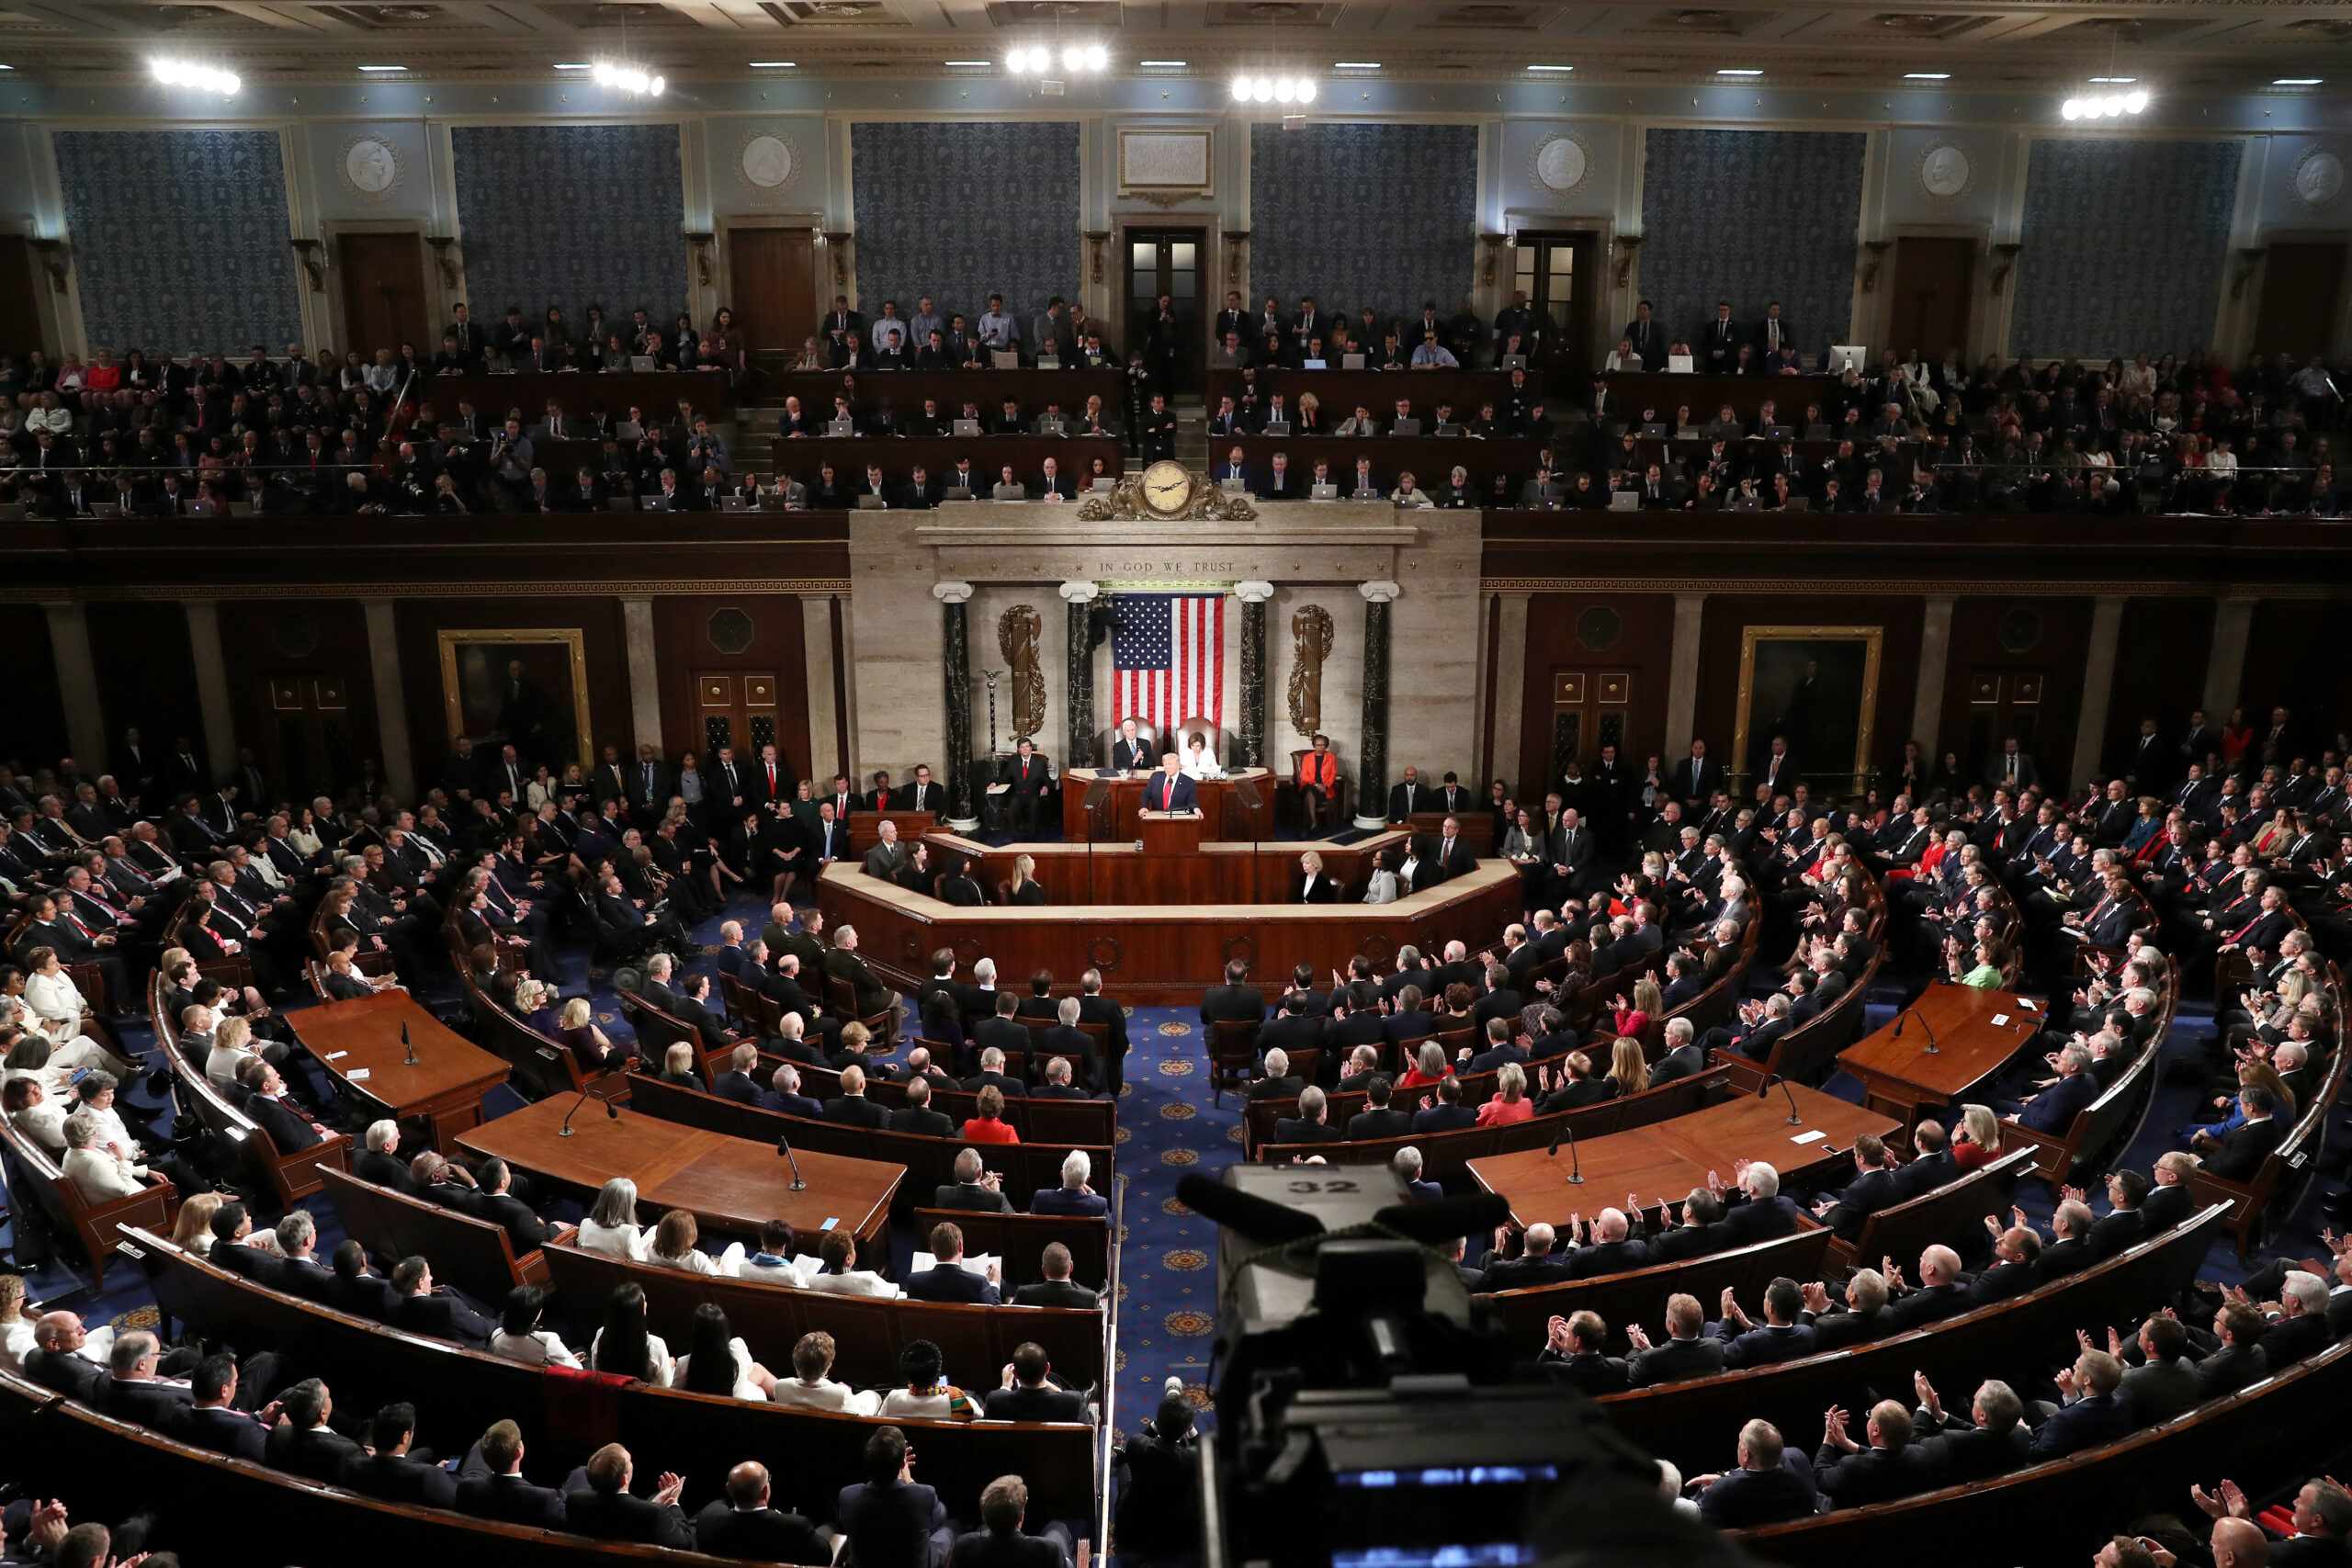
The chaos and controversy surrounding the 2020 presidential election—plus election takes that stress the role of race, gender, and education in solidifying President Biden’s victory—obscure a deeper current running through American political reality. Namely, even today, American politics remains fundamentally divided by family life.
Our colleague Lyman Stone recently highlighted one aspect of this story: Families and communities with more children tend to vote red. But there is another key dimension: Marriage continues to shape U.S. elections. This past November, married Americans and communities with more married men and women were markedly more likely to vote Republican.
A cursory look at 2020 election polling data reveals a sharp divide between married and unmarried adults. The AP VoteCast (a massive online poll fielded in the days just before the election) suggests Donald Trump received a comfortable majority of votes among married men and women (54 percent).

Polling data also suggest that Trump gained ground among married women in 2020. According to the National Exit Poll, Hillary Clinton won 49 percent of votes from married women in 2016, compared to Trump’s 47 percent. In comparison, the AP VoteCast suggests Trump won a majority of votes from married women in 2020 (52 percent compared to Biden’s 47 percent).
But polls and exit polls are notoriously unreliable and conclusions on voting behavior should consider additional data sources. Here, we use the latest 2020 election returns at the state and county levels to suggest marriage heavily influenced 2020 voting decisions. As shown in the chart below, states with a higher share of married adults cast a greater share of their vote for President Trump in 2020 compared to states with a lower share of married adults.

State-level trends, however, are not granular enough to draw strong conclusions. The chart below plots county-level votes for President Trump versus the share of a county’s residents over age 14 who were married according to the 2014–2018 American Community Survey. We find a strong association between marriage and voting Republican. In fact, a 1 percentage point increase in marriage was generally associated with a 1.2 percentage point increase in Trump’s share of the vote. To get a sense for how marriage stacks up against other demographic variables, we ran a multivariate regression. We believe that marriage is the strongest predictor of 2020 votes, when stacked against other demographic data such as race, ethnicity, income, education, and population size (Table A1).

This trend is not just isolated to voting patterns for Trump. We identify a similarly strong relationship between marriage and voting behavior in senate elections. For senate campaigns, too, marriage is up and away the strongest predictor of counties voting Republican (Table A2).

It also appears this association might have strengthened slightly since 2016. A multivariate regression looking at the county-level vote swing between 2016 and 2020 shows a modest but statistically significant association between higher levels of marriage and an increase in Trump’s vote share (Table A3). Admittedly, this association is weak and Hispanic ethnicity and income were stronger predictors of vote swing. However, a small and statistically significant relationship remains.
Our analyses uncover a critical relationship between marriage and voting. But they do not tell us which direction that relationship flows. On the one hand, we know that marriage is simply a higher priority for people with a more conservative worldview. At the community level, it is possible that conservatives are more inclined to marry and more likely to settle in communities where most other adults are married, too. On the other hand, marriage may push men and women to the right. For instance, married Americans tend to do better financially than unmarried Americans, so they may come to value lower taxes and require fewer government benefits than unmarried Americans. Undoubtedly, the relationship between demography and politics in American life is reciprocal.
It is also important to note that marriage is only one of many factors playing into the voting behaviors of Americans. As Lyman Stone suggests in his most recent report, the link between family life and voting conservative is influenced by marriage and fertility. To illustrate this, when we restrict our analyses to only counties for which fertility data is available from the CDC (about 600 counties), we find that both marriage and fertility predict voting red (Table A4). Nevertheless, marriage remained the strongest predictor of Republican voting.
The past several decades have seen a growing chasm in the family experiences of Americans, accompanied by a realignment between parties that has largely fallen along family lines. One crucial dimension of this divide—a dimension that is often overlooked by journalists, academics, and policymakers—is the extent to which unmarried Americans tilt Democratic and married Americans tilt Republican. It remains to be seen if President Joe Biden and his administration will begin to bridge this divide, or deepen it.
Peyton Roth is a research assistant in poverty studies at the American Enterprise Institute.
W. Bradford Wilcox (@WilcoxNMP) is director of the National Marriage Project at the University of Virginia and a visiting scholar at the American Enterprise Institute.